Journalism professor Jay Rosen had a couple of questions on Twitter last week that got me thinking. First he asked how we can change the news system to better serve news users of different levels in terms of their understanding of a topic. Later, in a related tweet, he pointed to an American Journalism Review article about attempts to crack the context-of-news puzzle, with Google’ s Living Stories project and Salon’s topic pages (like this one) as examples.
The two problems are obviously interconnected, and I think solutions to the context-of-news dilemma will help answer the multi-level-users question. To me, a key part of the solution is breaking the news down into granular bits of information and then organizing those bits to create 1) an overarching, constantly updated narrative/visualization of the news that elucidates the connection between those bits and 2) a basic-to-complex progression of information that users can jump in at whichever level best fits their familiarity with the issue.
What We Have Now
Let’s look at the make-up of news stories. They are made up of various bits of information, which can include anything from an event (e.g.: a speech, a study, a milestone accomplishment) to an evergreen piece of information (e.g.: a building code, a scientific concept). Let’s call these newggets (pardon my lack of skills in coming up with clever made-up nouns).
Usually, something happens (which is in itself a newgget) that spurs a journalist to write a story by pulling together a number of newggets and arranging them in a way that draws connections between them to form a narrative.
As news related to that initial story develops, more stories are written, each usually spurred by the introduction of some new newggets, which are given some background by referring back to some existing newggets. Each of these stories show the connection among the newggets within it, but they are isolated units.
And then along came the wonderful Internet, which allowed us to link from one story to another. That established connections among stories.
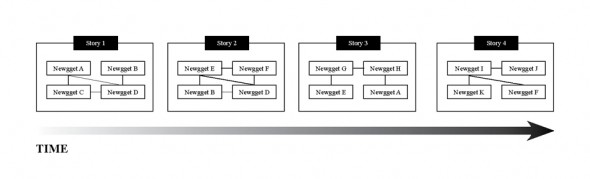
The Internet also made it easier for us to organize stories in other ways to help add context, such as chronologically:
When tags came along, we gained the ability to easily put the stories into different groups:
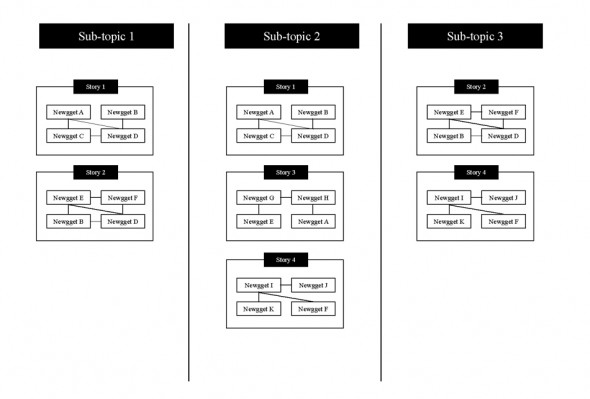
This is where we are today, and formats such as topic pages and Google’s Living Stories use linking, timestamps and timelines, and tagging to demonstrate the connection among stories.
Where the Current Efforts Fall Short
To be honest, when I looked at the Living Stories project, my first reaction was “meh”. Even now, I’m not convinced it’s all that big a leap. Granted, the presentation and packaging of the stories are a bit of a departure from the norm you typically find on a news organization’s website, but ask yourself this: What does the Living Stories format contribute to context that you can’t get with just some good tagging, timestamping, and a brief summary of the topic? My feeling is: not that much. Even without the timeline, you would still be able to see which story happened when just by looking at the timestamps, and since most such story lists are in chronological order anyway, all you have to do is scroll to bottom of the list and work your way back up to get an idea of the sequence of events. As for the categorization by sub-topics and types of stories, that’s just tagging.
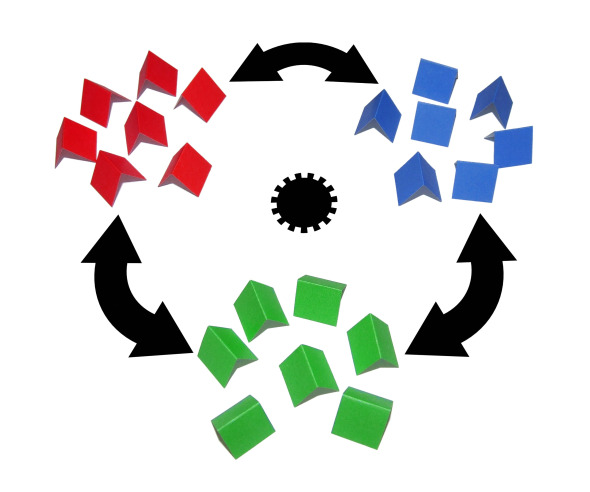
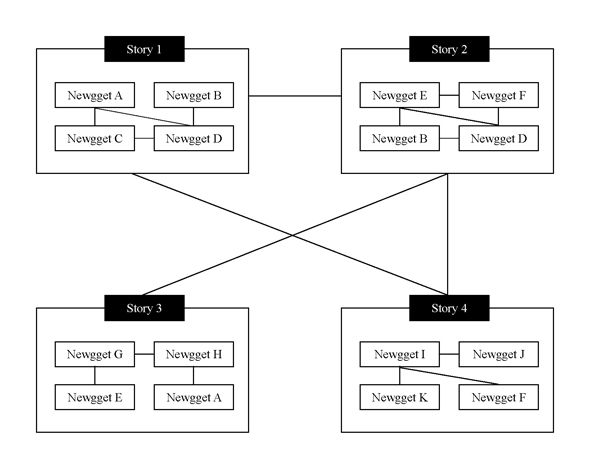
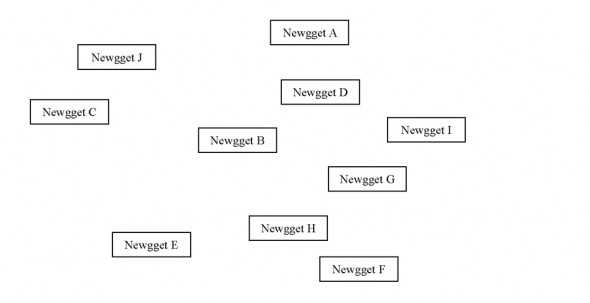
I think while the Living Stories project is a step in the right direction in terms of presentation, its effectiveness was hampered by the fact that it did not have the right type of content for its format. The entries are still pretty much your typical newspaper articles with just minor tweaks. Each is written as a one-off, so each is a self-contained narrative with new and old newggets. Because of time and space limitations and the need to stay tightly focused on the new newggets that were the impetus for writing the story, none of these stories include all the newggets for the topic, so whatever connections they draw among the newggets are localized to just one corner of the vast web of connections that exist among all the different facets of the issue. While inter-story linking, the timeline, and the tagging help explain the relationship among the stories, we don’t really have a good elucidation of the relationship among all the newggets. So despite all the organizations of stories illustrated above, when it comes to the information they contain, we often have a jumble like this:
Possible Solution
To understand the connection among tidbits of information rather than among the stories they comprise, we need to deal with the news on the basis of those tidbits rather than the stories. This is where granular bits of information may help. The idea that the “article” is an obsolete basic unit of news has already been floated, such as in this Jeff Jarvis piece, in which he suggests using “topic” as the basic unit and presenting a topic in an ever-updating, blog-style approach. That’s a good idea, but I think “topic” is too big a unit. Perhaps the basic unit should be just a newgget — a piece of information. For instance, the basic unit in our system would not be a story about a new study on climate change, but rather each of the individual findings in the study that lead to the study’s conclusion. Instead of a season preview story about a sports team, our basic unit would be things such as the team’s returning players, its performance last season, and its off-season additions.
Breaking the news up into granular bits could provide the content type that would be a better fit for a Living Stories format. Right now, the format is dealing with stories — whole collections of newggets old and new that are picked out of the pile by the journalist and arranged in a way to create a narrative focusing on the latest newgget that was the impetus for the narrative. From that perspective, its focus is too narrow and its bundling of newggets too cumbersome and inexact if we attempt to use it to explain how everything fits in the big picture. If you break it down to tidbits and fit each tidbit into the organizational structure that Living Stories provide, I think you would get much more utility out of the format. Doing so creates a database of objects that can be used in a variety of ways. The output from this collection can be something in the form of a typical narrative or a non-traditional presentation. To ensure that kind of flexibility, however, I think the input format needs to be granular. Another advantage is that if you enter your news in the form of newggets and then build narratives out of them, it would be easier to set up a system where when one newgget changes, you update that newgget and the update is reflected everywhere that original newgget appears.
Connecting the Dots
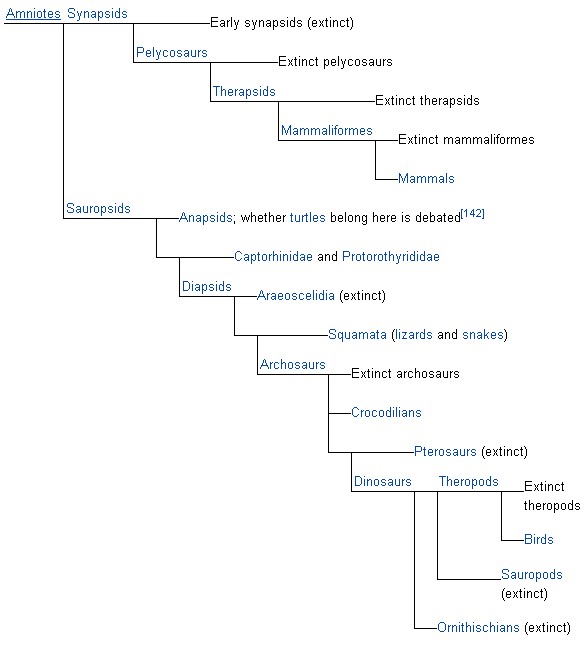
But granular newggets are just the beginning. Once you have all these individual bits of information, you need to organize them. The easiest and most obvious one is chronologically, at least for the newsy tidbits. Another is by subject (tagging). However, more important is a diagram, whether literally or figuratively, that explains where everything falls. Compared to this, chronology and categories are but blunt instruments of organizing information. Consider this family tree for dinosaurs:
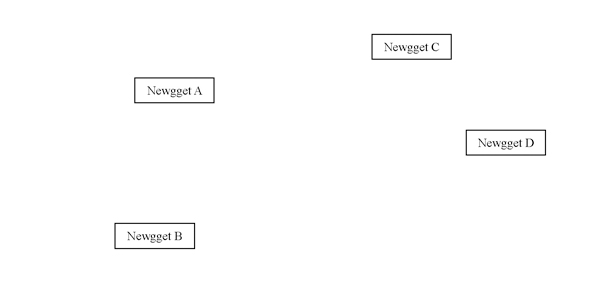
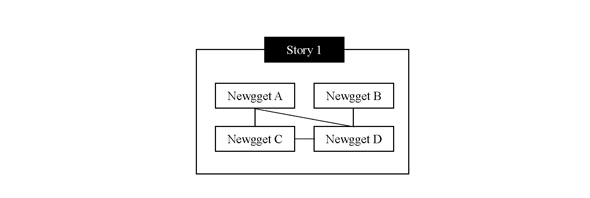
This tree gives us information that we don’t get just from a list of the the organisms (granular bits of information), the general groups each falls into (tagging), and the approximate time in history when each existed (chronology). This is something that I think current approaches to providing context for news, such as the Living Stories format and topic pages, have not addressed. Putting timestamps and tags on stories is easy but a relatively crude way to connect items. What’s much more difficult but ultimately much more useful is putting each tidbit of information in the right place in the big picture, connecting them in a way that shows their relationship to each other, and revising the diagram as new tidbits of information emerge. If we are able to do that, we might go from this:
to this:

Imagine that the diagram above represents a science and policy issue. Let’s say it’s about a city’s debate over whether to require every resident to build a koi pond in their yard because scientific studies have shown koi ponds to be wonderful things for the environment. Newgget C and the branches under it represent the science aspect of the debate. The organization of the diagram alone tells us how significant each tidbit of information is to the big picture (e.g.: Newgget M is but one of several components making up one of several studies that support koi ponds).
Now, let’s say we get a new finding (Newgget O in the diagram below) that calls into question the validity of the the scientific component represented by Newgget M. So you update your diagram:

What this shows us is that what has been thrown into question is but one of multiple components making up one of multiple studies that provide scientific support for koi ponds. This is a much more exact idea than “A new study has cast questions on existing scientific support for koi ponds.” This gives us context on how much impact the new study has and whether it’s significant enough for us to throw out the scientific data for koi ponds. It shows us that if Newgget H is disproved instead of Newgget M, it might be a more significant blow to the science behind the politics.
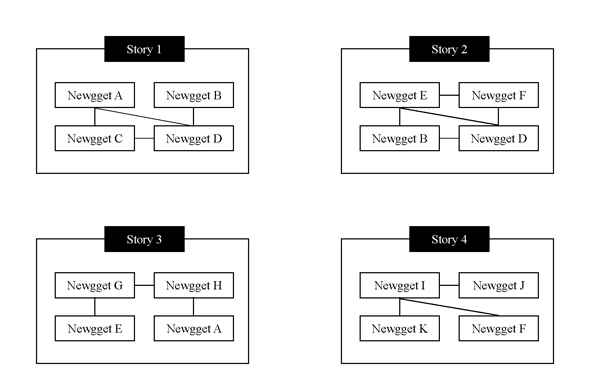
Of course, a more realistic diagram for elements of a news story would not be so neat and straightforward. It would probably look more like this:

However, even a messy diagram such as this is useful (and perhaps more useful) for context. Compare the impact of the displacement of Newgget E above with the displacement of Newgget B below:

Such a diagram would also help us identify holes in the context that need to be filled by making us ask, “Are there lines to be drawn between X and Y?” or “How does what happened to X affect Y?” Going back to the koi pond example, imagine the Newgget B is a scientific study and that Newgget G is the fact that a city council member cited the study in voicing his support for koi ponds. Now, if Newgget K discredits Newgget B, we can easily see from the diagram that the basis for the councilman’s stance has been undermined. That should lead journalists to go back and ask the councilman how the revelation of Newgget K affects his stance, and then if that changes Newgget G, the journalist would follow the connecting lines to trace its effect on newggets connected to G.
Of course, the diagram itself is not enough to give full context. You still need an overarching narrative updating people on the latest developments and explaining in greater detail how those developments affect the big picture. However, instead of writing a fresh narrative every time, you might be constantly updating the same narrative instead. Also, such a narrative may not take the form of a long article, but rather serve more as a central hub pointing to various shorter items about individual newggets or groups of newggets.
Building a Visual Quickstart Guide for A News Story
Now, to use the system we’ve set up to help address the issue of multi-level news users. When I’m trying to teach myself a new design program or a new programming language, I almost always pick up a reference book from the Visual Quickstart Guide series. These books are very handy because each is written in such a way that it first helps you build a basic foundation of knowledge on the topic, and then builds upon that a little bit more with each chapter. Also, a book is broken up into basically sets of information about particular subjects rather than as one continuous narrative, so if you’re a more advanced user but need help with one particular topic, you can jump straight to that topic and quickly get your answer.
Now, take that concept and apply it to news. Start by providing people with the information they need to form the basic foundation of knowledge necessary to understand the issue. Great explainer pieces, such as This American Life’s “The Giant Pool of Money“, already do this. They first explain the basic terms in a way that the lay person can understand. Then they use those basic terms to explain intermediate concepts, and then refer to the intermediate concepts in explaining even more complicated ones. It’s a great way to break down the knowledge barrier to true comprehension as people read the latest update about a news topic.
The granular tidbits of information we entered into our system to create the context diagrams can be repurposed to create such news quickstart guides. Arrange the newggets in order of complexity, then tell the users to start with Newgget X and Y before they move on to Z. Then, after they’ve groked all those items, they should be able to understand A and B. Often, this will not be clearcut, but I think there are general levels of complexity that we can assign newggets to.